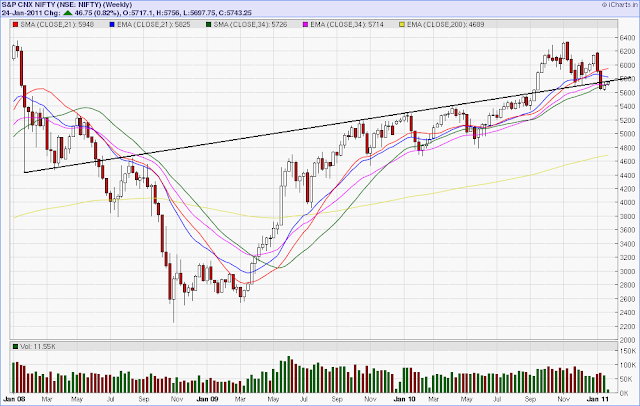
Charts of both bank nifty and Nifty show that we may have short term bottom for a week or two to let government collect money through sail fpo

What's being said about... Indian Stock Market
My Blog List
Chart Options
Saturday, 29 January 2011
Nifty - Lines of resitance and supports - EOD 28th Jan 2011
Charts of both bank nifty and Nifty show that we may have short term bottom for a week or two to let government collect money through sail fpo
Thursday, 27 January 2011
Nifty - Lines of support and resistance - EOD 27th Jan 2011
Wednesday, 26 January 2011
Nifty - Lines of support and resistance - EOD 25th Jan
Monday, 24 January 2011
Saturday, 22 January 2011
Nifty - Lines of resitance and supports - EOD 21st Jan 2011
Added Banknifty charts to see the main culprit of the fall in nifty and which can easily take it to new highs. Bank Nifty Daily charts show a clear downtrending channel. Bank nifty is moving up from lower trendline but its now near 200 day ema at 10909. Once it crosses that then 11300 is the upper trendline resistance, however we need to watch 21 and 34 ema's and sma's on its way upwards.
Banknifty weekly charts hows an interesting picture. Banknifty tested its 2008 highs and now has closed above those levels which is good sign for next move upwards. Bannifty has exactly got resisted on friday at the upper most blue long term trendline. Needs to cross this for upward movement.
So everything is in pritine natural balance at tghis point of time. One thing is sure who ever wins on Monday is going to crush the other side very mercilessly. It pays handsomely to be on right side
Thursday, 20 January 2011
Wednesday, 19 January 2011
Nifty - Lines of resitance and supports - EOD 19th Jan 2011
Nifty exactly finds resistance at red trendline on weekly chart. It is important to cross this resistance for further run up.
Tuesday, 18 January 2011
Nifty - Lines support and resistance - EOD 18th Jan 2011
Nifty finding support on 200day ema. If it sustains above trendline joining Jan 2008 lows then we can resume bull run. 5800-5820 is the imporatant band to watch for a sustainable rally
Monday, 17 January 2011
Nifty - Lines of support and resistance - EOD 17th Jan 2011
200 Day EMA providing support and 34 Week SMA/EMA providing resistance. Are we out of woods? This week we should get answer, till then follow the trendlines and levels.
Friday, 14 January 2011
Nifty - Lines of support and resistance - EOD 14th Jan 2011
Nifty finally breaches 5690-5700 band and found support at 200 day ema. It remains to be seen if this support canhelp nifty continue on it long term uptrend as seen last in Jan and June 2010. Also nifty seems to have closed on median line in Pitchfork analysis.. Nifty price action is important in coming few days to determine its larger move. Vix, the Indian volatility index , is in a larger downtrend channel and recently broke above the upper trendline is approching major resitance levels. So watchout shorts, nifty may have surprise in days to come.
Thursday, 13 January 2011
Nifty - Lines of support and resistance - 13th Jan 2011
Nifty still in limbo. 21 Week EMA provides resistance and trendline from 4480 ( first low from jan 2008 low) to 5690 provides support. Nifty still to decide.
Wednesday, 12 January 2011
Nifty - Lines of resistance and support - EOD 12th Jan 2011
Nifty seems to have found support from 34 SMA ( weekly). The key here is a close above 21 Week EMA and SMA to believe this counter rally
Tuesday, 11 January 2011
Nifty - Lines of support and resistance - EOD 11 Jan 2011
Nifty finds support on 34 SMA ( weekly). Let's wait for follow up if that is sustainable. The bad thing is that Nifty has closed below the trendline joining 5690 and 5721.


