Due to some technical difficulty at Google end Stock Market Prediction and Stock Calls Tips blog have been put offline. My sincere apologies for any inconvenience. I have raised the issue with Google and am waiting for their response.
Nifty once crossed the brown trendline on daily charts zoomed to close near the pink trendline on daily. 200 Day EMA is at 5604 levels and is a formidable resistance on upside. 5530-5550 is the level to watch downside.
Nifty reaches 28 Day EMA and showing reluctance to cross that. Important point to notice is that upmove recently is losing steam on volumes which is not a good sign for any upmoves.5510 and 5447 are the levels to watch for tomorrow.
Nifty seems to be eluding the bears on a regular basis. When everyone gets ultra bearish, it stages a smart recovery putting bears on backfoot. Nifty has till managed to save 5400 on closing basis last week too but has a cluster resistance around 5500-5550.It remains to be seen how nifty will close for this month.If it fails to clear 5500-5550 , then we may see another bear attack and should see sub 5300 levels.
Expiry blues out of system and it helped Nifty to close above 5400 once again. This upmove is still between the larger range of 5300-5350 to 5500. A weekly close above 5400 wold still keep bulls in business. Another point to note is that the fall on weekly chart is on diminishing volumes, so all those who are ultra bearish should be very cautious in medium term
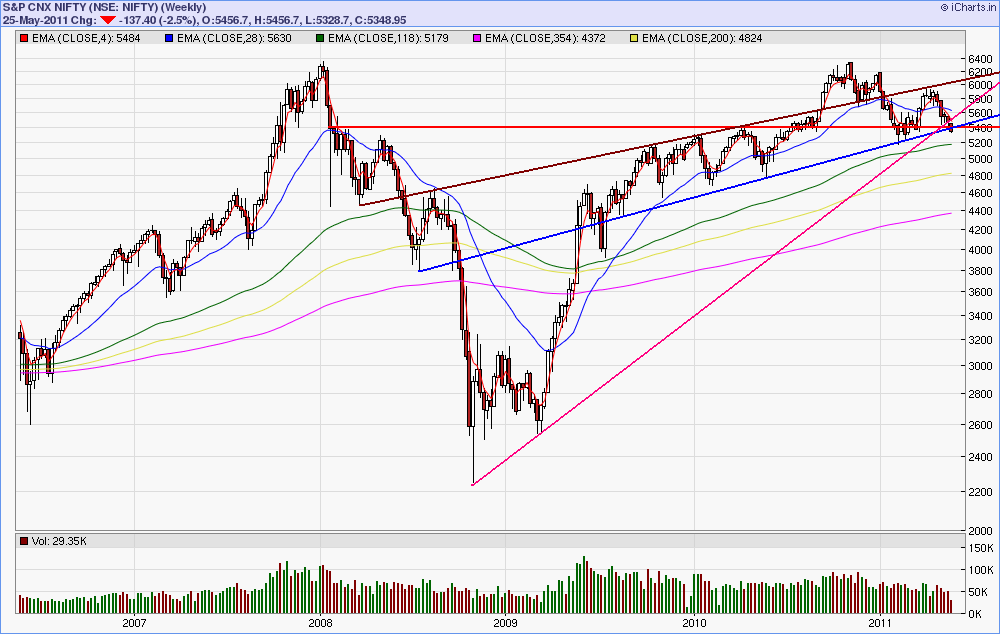
Nifty reaching cluster support near 5300 levels. Bulls need to conquer 5390 fast or else things may quicly go very dirty for them. Expiry day is a perfect setup which buuls can use. On weekly charts the price action is at juncture of three multi year trendlines and has significant importance for this week and next couple of weeks in terms of future direction.
Nifty still struggling at 5400 levels, however two closing below 5400 is not good for nifty. Its still withing the range of 5350 - 5500.With the bearishness around it makes sense to do a little bit of contra here but only a small quantity, 5417 is the key for today.
Nifty finally breaks 5400 and closes below it. Key for bears is to maintain the pressure and keep Nifty below 5400 for the next few weeks, then only the scenario would turn ultra bearish. It can still be a trading range with range expanding on downside to 5350-5300.
Nifty shows how much it respects 5400 levels ( confluence of red and blue trendline on weekly chart). Expiry week has two options - 1. To be a trading range week between 5550-5400. 2. Break below 5400 and give force to the downtrend direction. Exciting week ahead. Why is it that expiry weeks are so well positioned to make it difficult for everyone.
Nifty finding support on long term multi year trendline ( blue and red) shown on weekly chart.However it is important for Nifty to cross 5448 on closing basis to show some semblance of bullishness. Interesting Friday on cards
Nifty on crucial support. Weekly Chart gives clear picture on the long term implications. 5460 is the important level for nifty for tomorrow to give first indication of completion of correction.
Bulls on last support. 354 Day EMA at 5433 and weekly blue trendline are now lifeline for bulls. Any breach on sustainable basis will create panic in Market.
Bears working hard to get Nifty down but still we appear to be in the bearish flag in daily charts. This opens up further up moves till the bearish flag breaks down. 5520 is the key here, break on upside will be first indicator that we are still in the bearish flag and as such upsides still in store.
Nifty attempted bounce on back of assembly results makes no material change to the situation. 200 day ema at 5624 proves to be formidable resistance.Action is most probably going to be around 5534 levels. Gimme 5300... says Bear
Nifty still testing the resistance line (black line) on daily which not very long ago had formed its support. Volumes on lower side do not augur well for this rally from 5400 odd levels. 200 Day ema at 5626 is a formidable resistance to conquer for bulls. If not then we might head to 5400 levels again in a very short time, which is key to direction to future.
Nifty testing the black support line which was recently breached. Next few days action will determine the corrective nature of bounce or whether this is end of the correction which happened for nine days.
Nifty bounces exactly from 354 Daily EMA at around 5430 levels to close just below 4 Day EMA at 5555. Nifty not exactly out of woods and there may be shocks on the way. If this is just a corrective bounce then we may have a another shot at 5400 levels and if that does not hold then lower levels on cards. As of now Nifty closing is just on the long term trend line joining march 2009 lows on weekly chart,any breach of this trend line can be seriously damaging to Nifty.
Nifty on a downward spiral. Now almost on the all important support region of 5400 levels. Break of trendline on daily charts connecting last three lows is very damaging in nature. Key level to watch is 5430 and atleast a close above 5558 is needed to keep bulls interested.
Nifty testing black trendline on daily charts. Five red candles in a row. Public getting bearish. Nifty making everyone think
Nifty succumbs under 50 bps attack from RBI. I still feel its not the tie to be bearish. Bulls still have chance, now that Nifty is now on the trendline ( black on daily chart) of the recent lows. Any break of this is going to be seriously damaging to the health of nifty and fast fall till 5400 levels will not be a surprise.5680 level is key for still maintaining that bullish undertone.
Nifty hits target as suggested in last day's post and is precariously supported at pink trendline in daily and 28 Week EMA 5682. Expecting a bounce from here post the bad news from RBI. Thepink trendline is important because it halted two upmoves earlier and now it has been tested twice. Important level for tomorrow is 5750 -60 levels.
Nifty as suggested in earlier post has tested 200 DMA with closing just above it. Nifty is going for lower levels as long as it stays below 5794-5801 levels. Downward targets are seen at around 5680 levels if it beaches 200 DMA again. Sustained closing below 200DMA at 5747 will be damaging for Nifty
Nifty monthly charts clearly show that we have been in a rising channel since 2009 and except for a breakout in 2010 for sometime, nifty has been in a range. Even with the dowtrend visible on daily and weekly, Nifty is actually bullish till it is above 5713. Voila!!!. IF Nifty starts on a lower range this month, it may actually touch 6000 levels in May without violating any trendline resistance
The information and views contained on this blog are personal and believed to be reliable, but no responsibility (or liability) is accepted for errors of fact or opinion. The information on this website is updated from time to time. The blog however excludes any warranties (whether expressed or implied), as to the quality, accuracy, efficacy, completeness, performance, fitness or any of the contents of the website, including (but not limited) to any comments, feedback and advertisements contained within the Site.Use of this service is at the sole risk of the user / client. The data and information provided in the web site is not professional advice and should not be relied upon as such.The blog may at any time be edited, altered and or remove any information in whole or in part that may be available on this blog and that it shall not be held responsible for all or any actions that may subsequently result into any loss, damage and or liability.